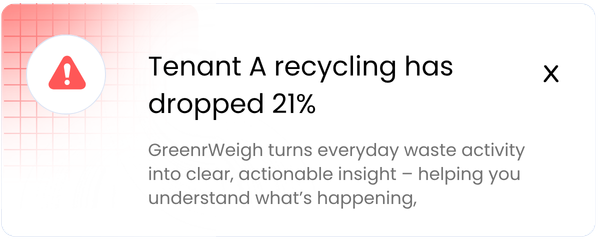
General waste increased 27% in six weeks.
Something changed. Would you know why?
GreenrWeigh turns everyday waste activity into clear, actionable insight – helping you understand what’s happening, identify where attention is needed and uncover opportunities to improve performance and reduce cost.
How well do you really understand your waste?
If you can't answer these questions, GreenrWeigh can help.
Book a demonstrationInsight isn’t only about what’s going wrong. GreenrWeigh also shows you where things are going right, helping you identify what caused the improvement and repeat it across the rest of the estate.
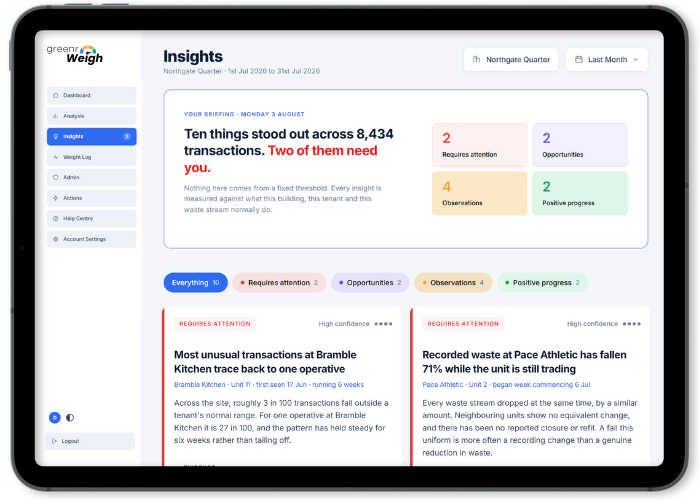
GreenrWeigh identifies what’s worth investigating. It won’t claim to know something the data can’t prove — an unusual reading is a prompt to investigate, never a verdict. Every insight links back to the transactions behind it, so the judgement stays with you.
Something changed. Would you know why?
A waste problem — or simply a training opportunity?
Great performance — or something worth checking?
Could your operation be planned differently?
What’s different?
Sites can generate thousands of waste transactions. Almost all of them are unremarkable. GreenrWeigh Insights reads the lot and surfaces the handful worth your attention
Tenant 14’s recycling rate has fallen from 64% to 47% over the past six weeks. The decline is steady rather than a single bad week, and total waste has stayed level.
Suggested:Review recent changes in disposal practices.
Three mixed-recycling transactions were significantly above this tenant’s normal range. All three occurred during evening collections.
Suggested:Check whether a one-off clear-out took place.
Recorded volumes suggest this waste stream has more collection capacity than it currently needs, across every collection in the last six weeks.
Suggested:Test a reduced collection frequency for one month.
General waste has reduced by 22% over eight weeks while recycling participation has increased across all three levels.
Suggested:Share what changed with the other buildings.
Insights photo
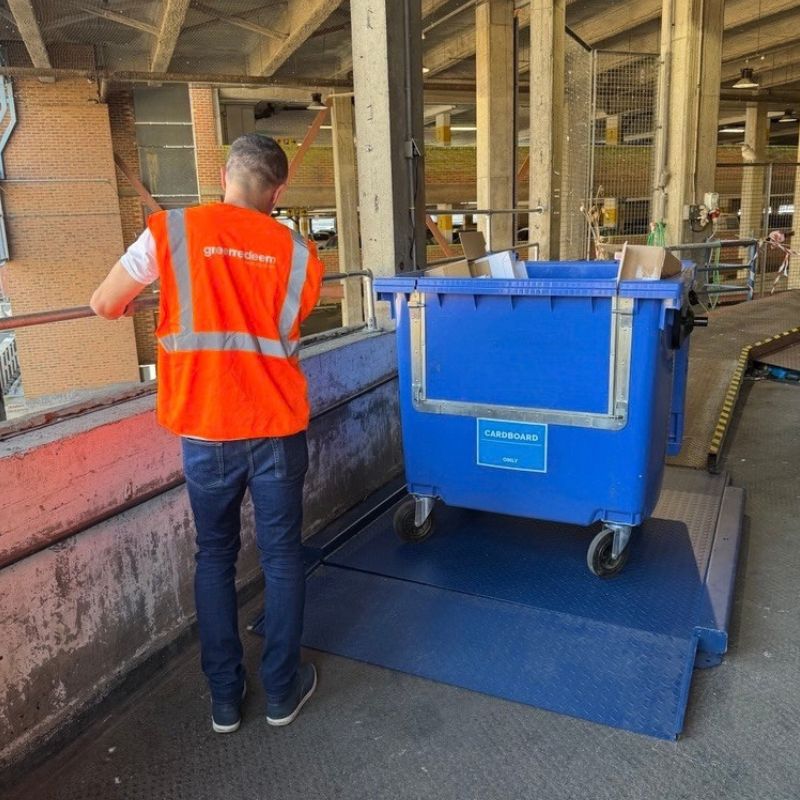
Step 1
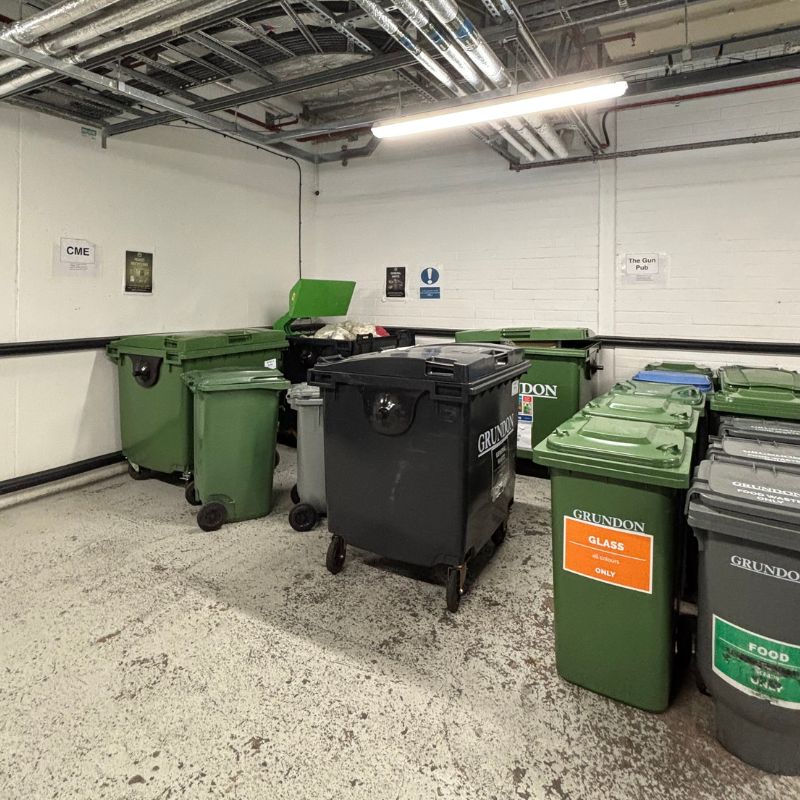
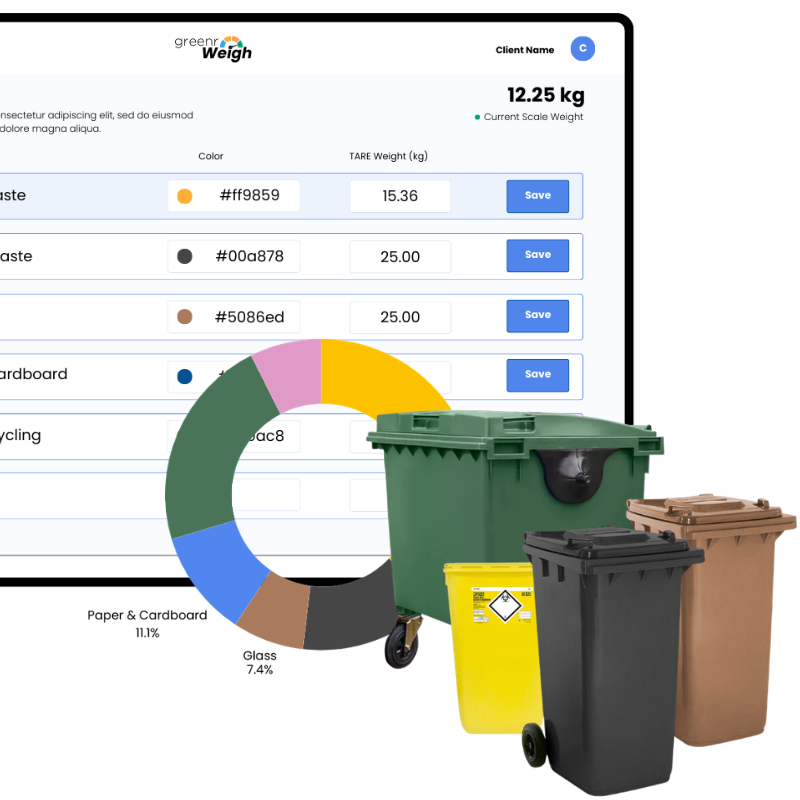
Before installation, the system is configured to reflect the waste containers and streams used on site. These colours are then reflected in the chart colours for consistency.



Colour coded waste streams match containers

Bins are weighed to establish tare weights

Disposal remains simple for staff. This ensures accurate and reliable waste data
Step 2
Four steps at the bin, a system configured around your site, and reporting that turns every disposal into something you can act on.

The operative selects their company using a simple interface. Access can be via PIN, QR code, or a straightforward company selection screen.

The correct waste stream is selected using clear icons and colour coding, helping overcome language barriers and ensuring materials are disposed of correctly.

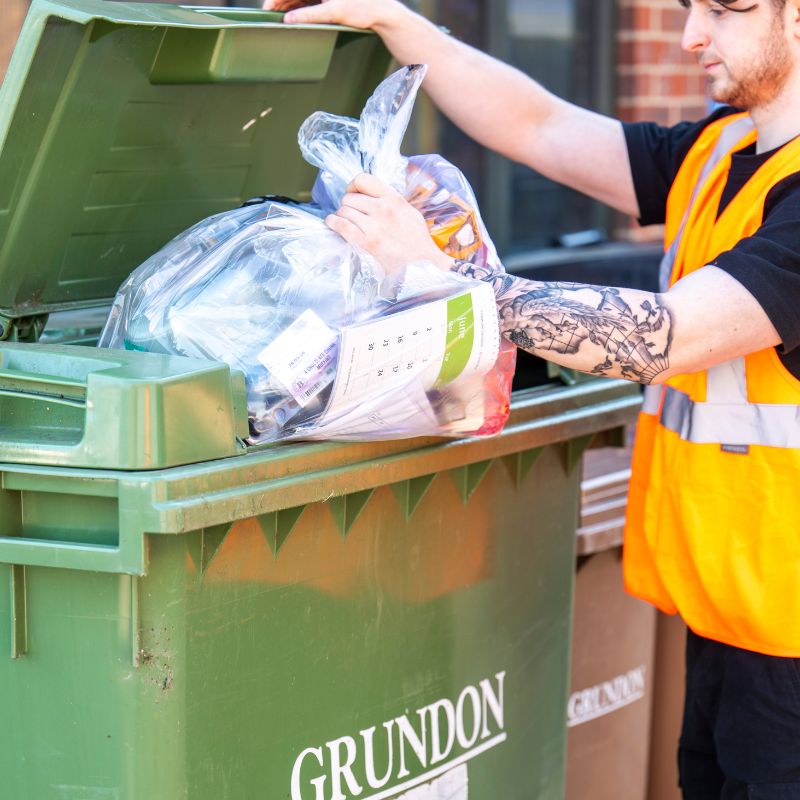
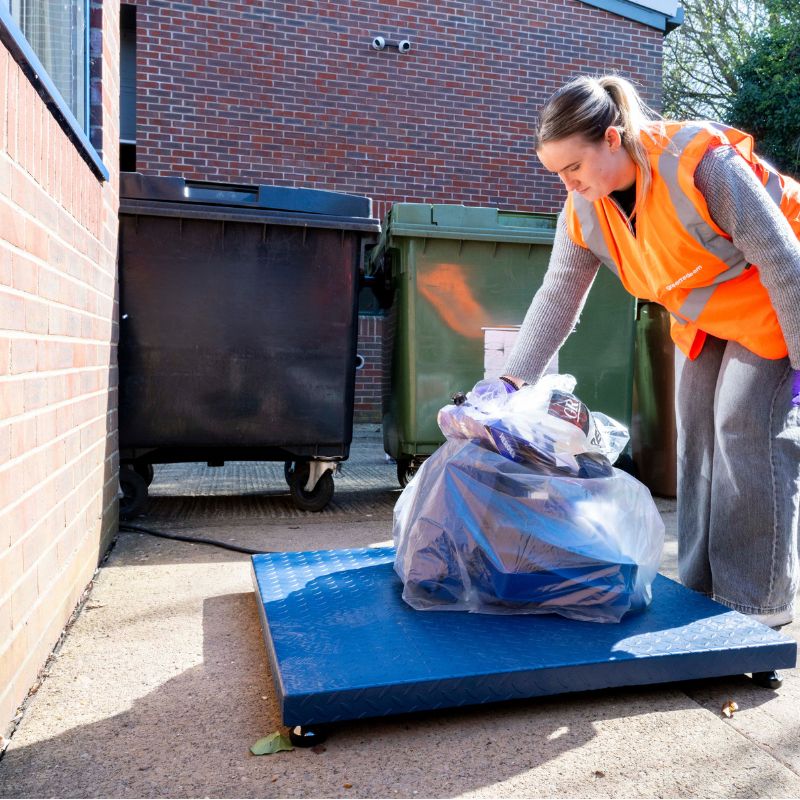
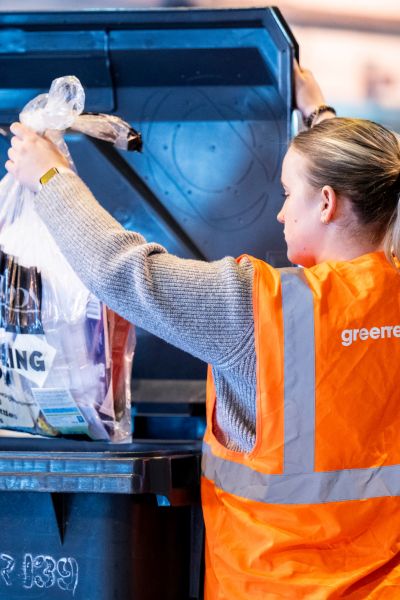
The bag, container, or receptacle is placed on the scale. The system automatically records the weight, waste type, location, and user details.

The disposal is logged instantly. The user can weigh additional items or walk away, with the system automatically resetting for the next operator.
Step 3
GreenrWeigh captures waste data at the point of disposal, providing organisations with clear visibility of waste activity across buildings and estates.

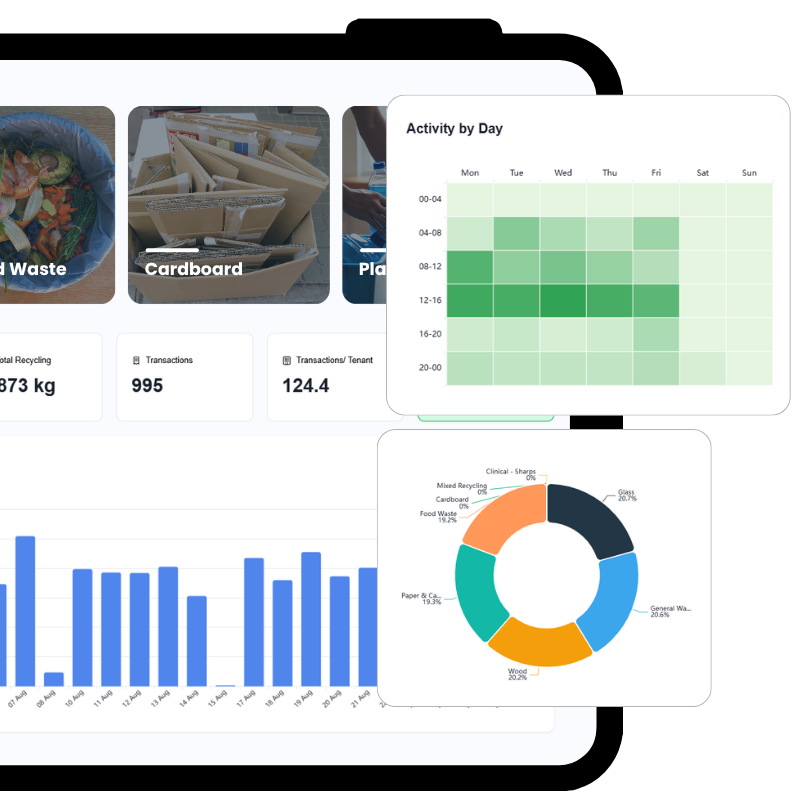
Understand how waste is distributed across recycling streams and general waste.

Track how waste volumes change over time.

View waste activity across tenants, departments or locations.

Monitor recycling performance and identify opportunities for improvement.
Step 4
Insight isn’t only about what’s going wrong. GreenrWeigh is just as good at showing you where things are going right, so whatever caused the improvement can be repeated across the rest of the estate.
A flexible, intuitive platform designed to make waste monitoring simple for users and powerful for operators.

Tenant-level weight and stream tracking

Operational guidance and tenant education

Exportable data for ESG reporting, compliance

Integrates with existing weighing equipment

Waste composition analysis

Operational dashboards and reporting


From one bag to an entire estate.
The same transactions answer different questions depending on who’s looking. Each user sees the information they need to act — and only what they’re authorised to see.
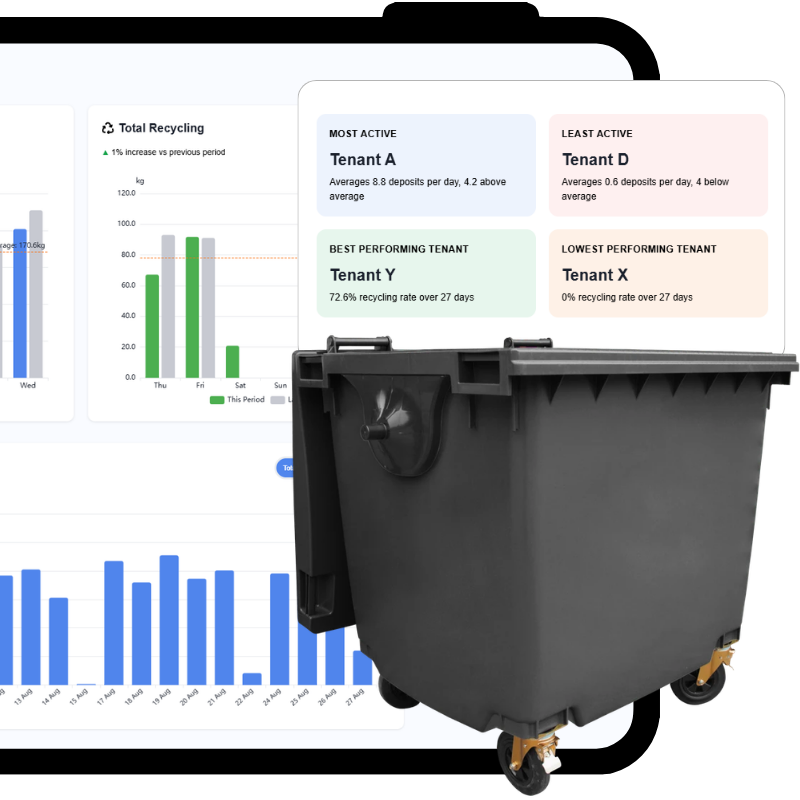
See:
Roll the same data up again and a portfolio starts to rank itself — which sites are improving, which need attention, and where the same fix could be repeated.
See:
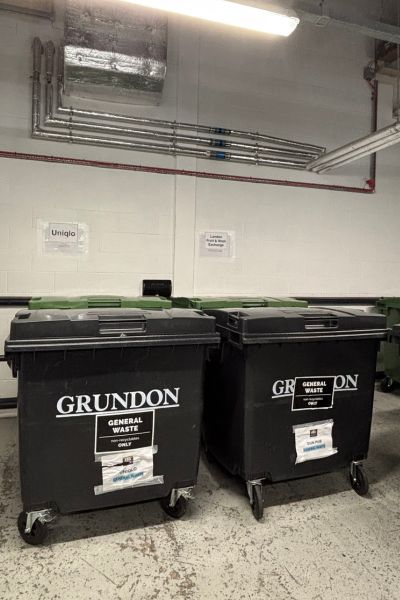
A single occupier sees their own activity and nothing else — enough to manage what they control, without exposing anyone else’s figures.
See your own:
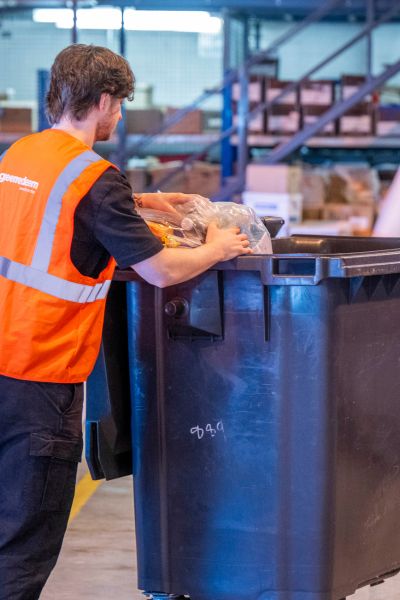
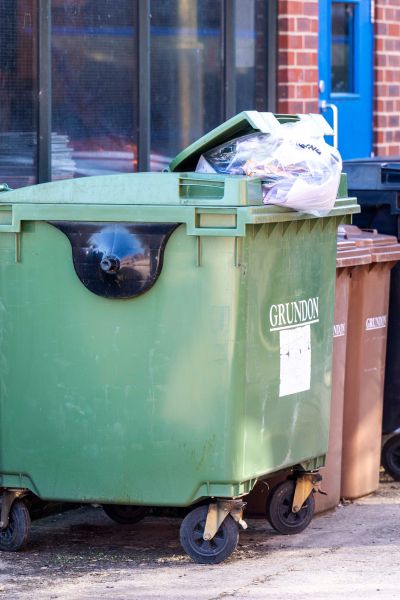
Configured for Your Site
The same weighing station and the same reporting work wherever waste is produced — only the questions being asked change.

Understand waste activity by tenant, floor or waste stream.
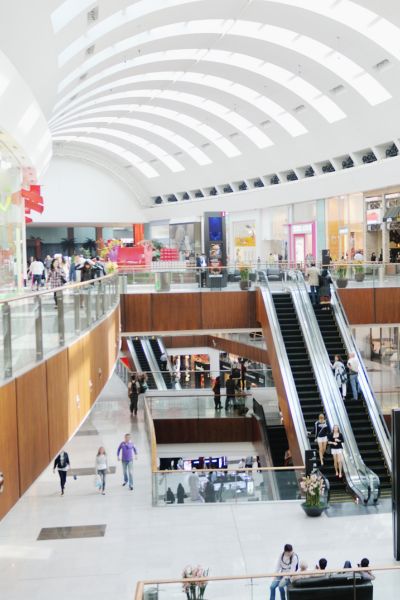
See what each unit produces and where the shared streams fill up.
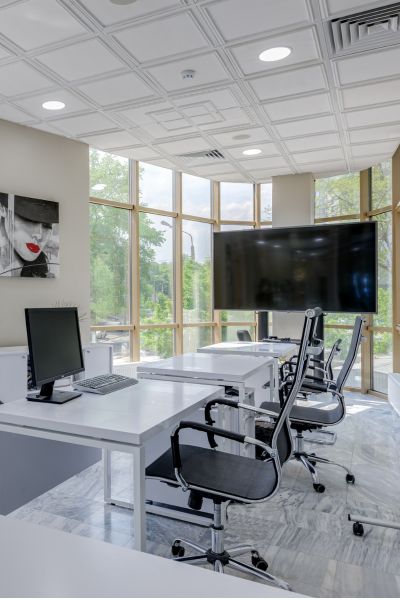
Understand waste activity by department, location or waste stream.
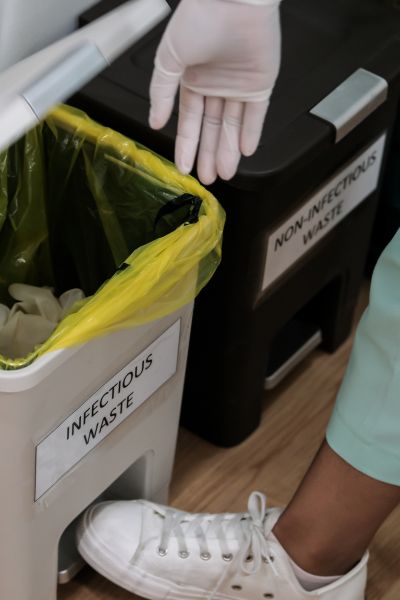
Keep clinical, general and recycling streams separate, with an audit trail.

Record specialist streams accurately, with the evidence attached.

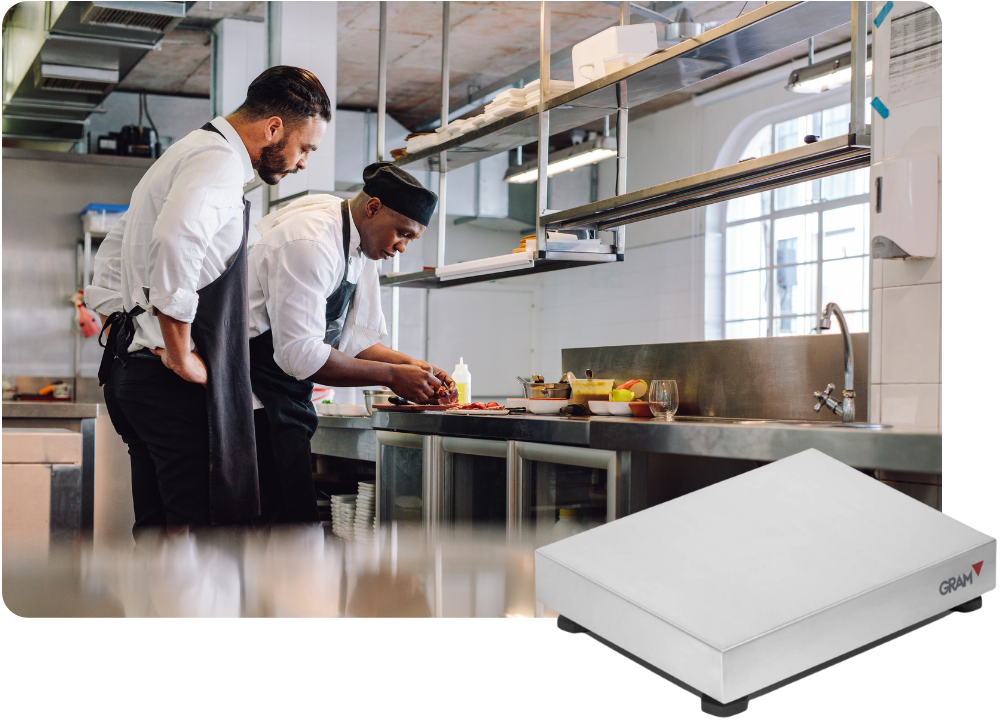
Measure food waste at the point it’s thrown away.
Answers to common questions about GreenrWeigh.
Contact us to learn more or arrange a no-obligation discussion about your site.